One of the often-touted values of farmland as an investment is that it provides a hedge against inflation. This is, in theory, due to the fact that the value of farmland rises during periods of elevated inflation. Thus, an investment portfolio that includes farmland would see better performance and less volatility when inflation rises than one without it.
So, is it true? In short, it seems to check out. However, more recent history suggests the benefits may be somewhat overstated.
What Is “Inflation”?
To get started, we need to provide something more useful than a generic or abstract summary of the concept. How do you measure and calculate inflation? What’s the right way to do it? (Stay with me)
As you may already know, there are some common statistics that are cited in news reports and in commentary from financial experts. Perhaps the most famous is the Consumer Price Index. But how much do you know about how that’s calculated?
Here are a few things I learned about that calculation, which are both interesting and relevant to this discussion:
- CPI is based on urban consumers. The current data series available from the Bureau of Labor Statistics (BLS) is for Urban consumers and average prices of things like tomatoes.
- The calculation changes over time, but the methodology is the same. CPI is calculated based on components (e.g. milk). The weighting of those components changes over time. Weights are updated from survey results assessing what percentage of household budget goes towards a particular item.
- There are multiple CPI calculations in use. The simplest example is whether seasonal adjustments are made or not. More important for our purposes is “Core CPI” which removes some components from the calculation.
A few comments on each of these.
Intuitively, it may feel a bit weird to think about farmland values, something that is by definition very rural, in relation to cost increases to urban consumers. However, according to BLS, “urban consumers” covers 90% of the US population.
The change in weights is typically small, even over multiple years. However, over the course of decades, this could result in greater shifts. It’s worth keeping in mind when comparing across large time periods.
That leads into Core CPI, which we’ll dig into more.
Why We Care About Core CPI
There are different inflation metrics, and Core is often used in analysis and discussion of the rate of inflation and the progress towards price stability.
However…
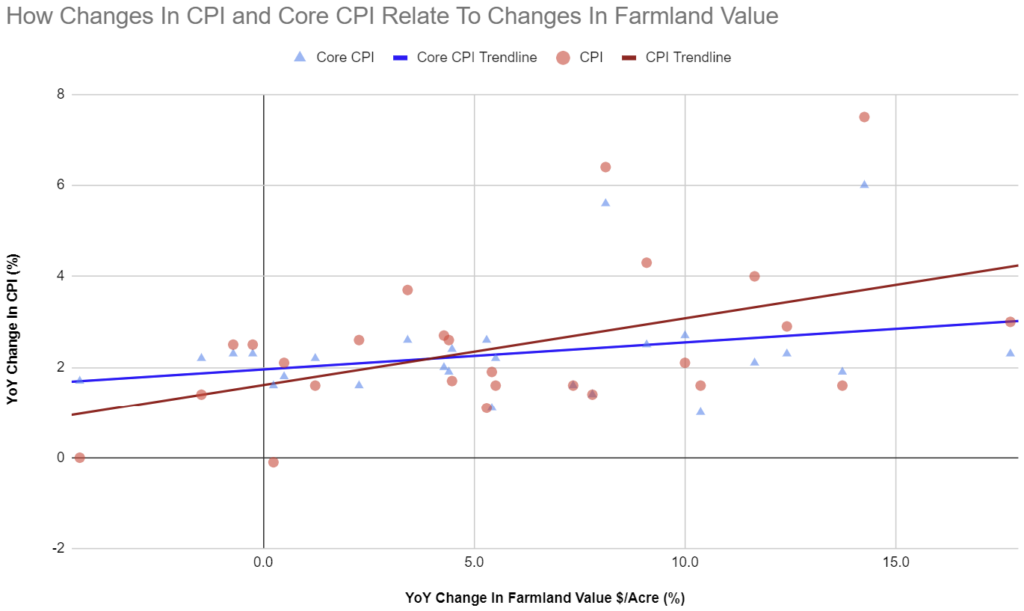
Farmland value is ~77% less related to Core CPI.

In the graph above, blue is Core CPI and red is CPI. When I calculate the correlation (using an adjusted r-squared value) for each of them we get:
- Core CPI – 0.0467
- CPI – 0.1992
Statistically, this suggests that CPI can “explain” about 20% of the change in farmland value over time, while Core can only “explain” a little over 4.5% of it.
What Is Core CPI Anyway?
It’s mostly the same as CPI, but it excludes Food and Energy from the calculation. The rationale given for this is that these prices are volatile.
Core is particularly popular now as everyone tries to track the trajectory of inflation, interest rates, and the Federal Reserve. Looking at month-to-month inflation numbers, a big swing up or down in food prices can cloud the picture.

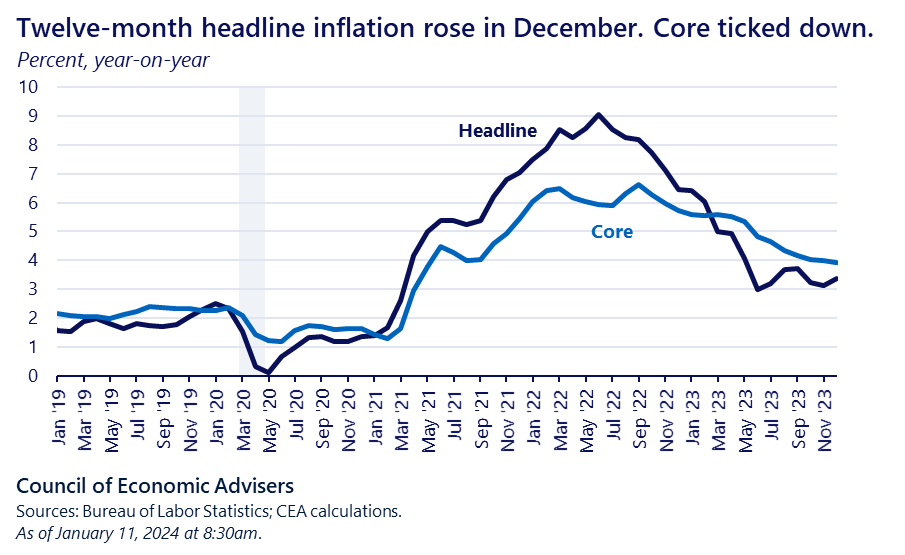
As an example of how these two diverge, here’s a graph put together by the Council of Economic Advisers. In this case “Headline” would be regular CPI.
You can see the perception that Core does a better job of assessing what some call “underlying inflation” from the naming alone. For the most part, the broad themes of both are consistent, but the details can differ significantly.
So, Is Farmland An Inflation Hedge?
Rising inflation has not historically resulted in significant negative effects to the value of farmland. Inflation can have a more severe impact on the valuations of many other asset classes. The reduction in inflation and interest rate volatility alone can make it a potentially useful tool in portfolio construction.
There does seem to be a relationship between CPI and inflation. With CPI explaining about 20% of farmland appreciation, it has been a significant factor, but far from enough to determine the outcome itself.
In regard to Core CPI, there is a very weak relationship. It’s weak enough that it could be argued that it has no meaningful impact on the price of farmland.
As ridiculous as it may sound, how strong the inflation hedge case is may come down to choose your own inflation.
Evaluating Other Claims
Many investment platforms that have farmland offerings do talk about its relationship with inflation. In a quick search, FarmTogether’s blog post was the first I found. So, we’ll quickly look at that.
In one paragraph, they state farmland has held a 70% correlation to inflation, while linking a research paper from 2020. The paper is from the TIAA Center for Farmland Research at the University of Illinois. The author is the director of that research center and a professor of farmland economics.
Given these credentials, this deserves a more serious evaluation.
Summary Of Differences
While we have very different conclusions, that may not be surprising given the differences in our methodology. Here’s the big three:
- Data Size – Professor Sherrick is analyzing a data set dating back to 1969 but ending in 2020.
- Data Selection – The calculation of farmland value is based on an aggregation of the 32 states with the most agricultural output.
- Returns Definition – The paper tries to approximate a far more advanced metric of “farmland returns.” The author tries to incorporate additional factors beyond land appreciation including rental income and property taxes.
- The Metric – While Professor Sherrick doesn’t specify, I suspect the paper may be based on the simpler Pearson correlation coefficient (as opposed to an adjusted r-squared value).
Deeper Dive On Differences
In regard to the first point, from the online data I can find from the USDA’s National Agricultural Statistics Service query page, I can only retrieve data going back to 1997. That means the first year-over-year performance we have starts in 1998. So, we have far fewer data samples. That having been said, I do wonder how relevant data from 1970 is today.
For the second point, there’s not enough context provided on why 32 states specifically were chosen.
That having been said, other research shows that not all states are equal. Another article published on the USDA website, shows the massive divergence in cropland value between different states over time. While the value of Texas and Iowa cropland was relatively close in 1962, Iowa’s value per acre is now approaching 4X Texas’.
Given that, removing data for certain states that may not have a significant agricultural output or that may have their own idiosyncrasies (e.g. Hawaii) might give a cleaner view of what to expect across the “most investable” regions of the US.
The third point of difference could make a huge difference in the results. In general, it’s not hard to imagine that the economic and political realities stemming from inflation could affect both property taxes and farmland rental income.
Lastly, the final point could be the main source of deviation. We could just be calculating different things. For reference, if I use the Pearson correlation coefficient, then with the same data I get the following correlations:
- CPI – 0.48
- Core CPI – 0.29
I chose to avoid this because two things that typically move in the same broad direction will register higher correlation than you might expect. As an example, I generated a random number between 1 and 10 for each year I had farmland appreciation data for and ran the correlation function. It came back at 0.34 – better than Core CPI!
Conclusion On This Example
In conclusion, I think the paper is legitimate and I expect the conclusions are reproducible given the same data and formulas were to be used.
That having been said, the ~70% correlation between farmland returns and CPI I still believe overstates how closely changes in inflation will translate to changes in farmland returns.
Originally sent to newsletter subscribers on February 19th.

